Debug Rust on Windows with Visual Studio Code and the MSVC Debugger
Debugging support for Rust when using the Microsoft Visual C++ (MSVC) toolchain is something that a lot of people (myself included) would really benefit from. There have been some improvements in this area that enable better debugging in Visual Studio Code (with a bit of tweaking)! Let's take a look at how to set it up!
Notes on toolchains
As of May 2017, there are two different ABIs that Rust can target on Windows. These are MSVC and GNU. By default Rust on Windows will target MSVC; as such this blog is addressing that case. For more information on these ABIs see the rustup README.
Required extensions
To get Rust MSVC debugging working in VSCode we're going to use a couple of extensions:
- C/C++: Brings in support for debugging MSVC applications. Since we're using MSVC behind the scenes, this gives us some debugging support for our Rust programs.
- Native Debug: Allows us to set breakpoints by clicking next to line numbers.
Edit: It has been brought to my attention that rather than using Native Debug you can set the following setting to get breakpoints enabled everywhere: "debug.allowBreakpointsEverywhere": true.
Configuration
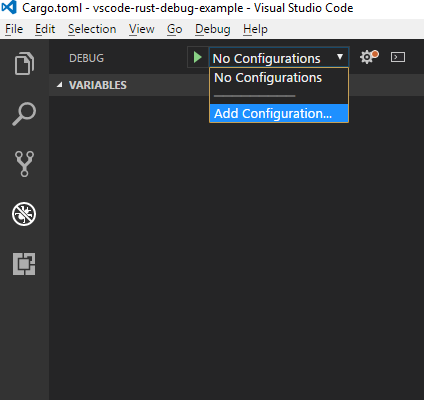
Debugging in VSCode is configured from the debug view, which we can get to by clicking on the bug icon, or via Ctrl + Shift + D. In this view there is a drop down box to select or add a launch configuration:
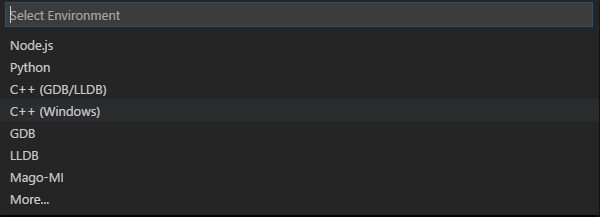
From there we're given a drop down menu offering a number of debug configurations. For MSVC rust debugging we want C++ (Windows).
Now we're presented with a newly created launch.json file, which contains a skeleton debug config. There are various settings that can be tweaked here, but the only one that really needs to change is the program which needs to be set to the program to debug.
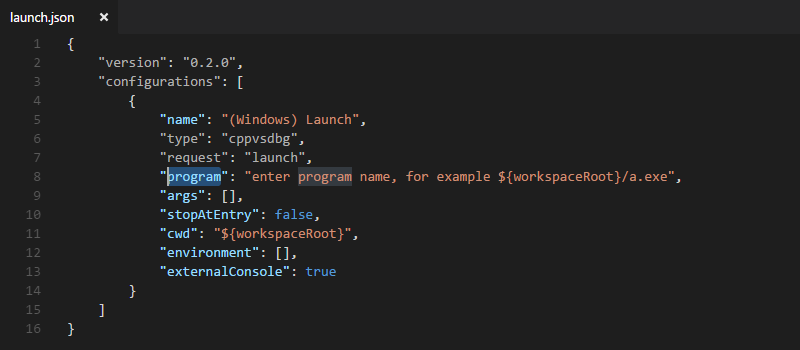
Change this value to point to the debug binary. From there the Native Debug extension (edit: or "debug.allowBreakpointsEverywhere": true setting) should allow us to click in the columns to set break points, these will then be hit when running with the debug settings we've just configured.
Visualizers
The Visual Studio debugger we're using behind the scenes supports creation of custom views for native data, natvis.
If Rust nightly is installed via rustup, it will come with a few of these visualizers. To get these to work with VSCode copy them from the nightly dir to VSCode's debugger extension dir. For me that means copying from:
C:\Users\B\.multirust\toolchains\nightly-x86_64-pc-windows-msvc\lib\rustlib\etc
to
C:\Users\B\.vscode\extensions\ms-vscode.cpptools-0.11.2\debugAdapters\vsdbg\bin\Visualizers
Note that these visualizers help with some types and not others. We can open the files up and look at their XML guts to get an idea on what types they work with and how they do so. In my experience, there are still plenty of types with which debugger doesn't yet play nice.
Worked example
To showcase debugging, let's use a simple example. If you want to follow along you can copy the code from below, or grab a clone/get a zip from here. If you want a copy with the debug config included, you can find it here.
fn another_function() {
    let message = "I'm a message in another function";
    println!("{}", message);
}

fn yet_another_function() -> u64 {
    let number = 2;
    let another_number = 5;
    number + another_number
}

fn main() {
    println!("Hello, world!");
    another_function();
    let number = yet_another_function();
    println!("{}", number);
}
Following through the steps above let's set launch.json's program value to ${workspaceRoot}/target/debug/vscode-rust-debug-example.exe, make sure the build is up to date: cargo build, and we're good to go.
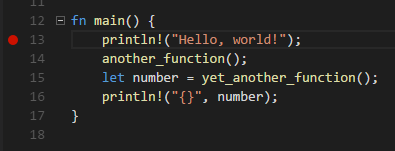
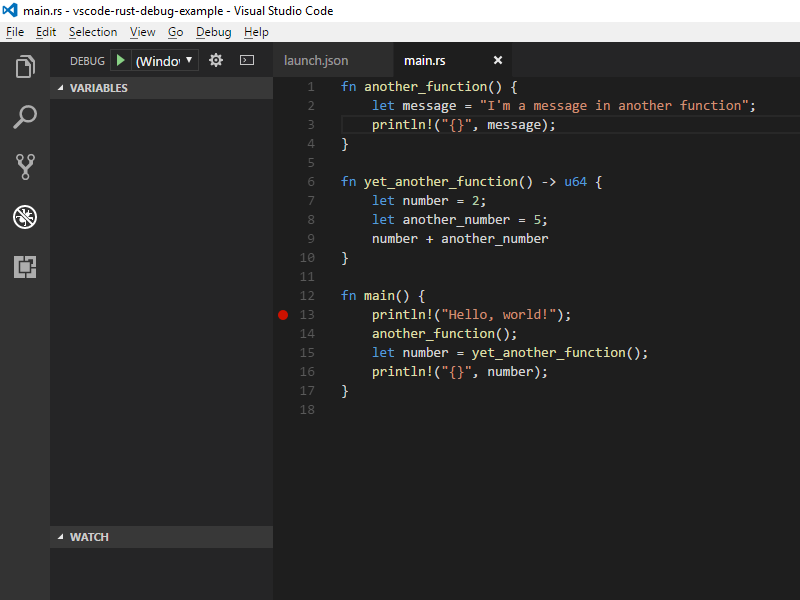
Let's set a breakpoint early in the program before running:
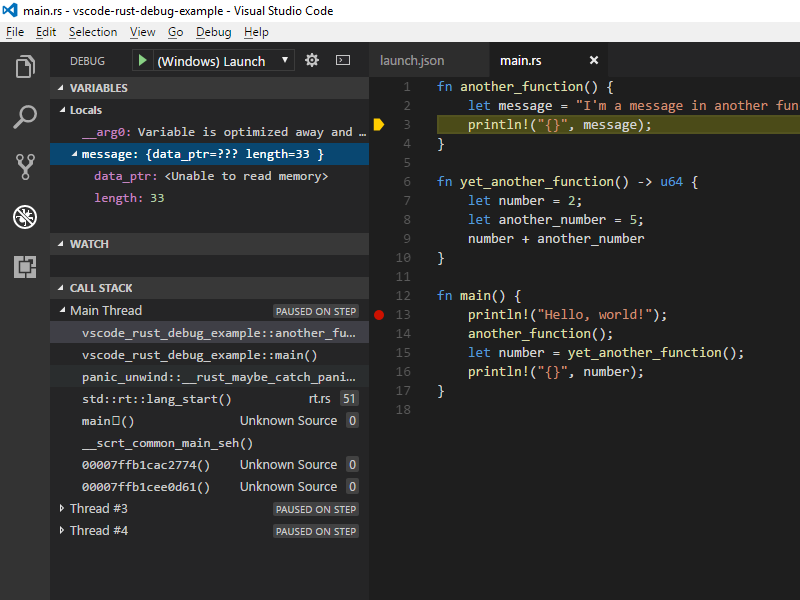
To start debugging click the little green arrow or hit F5. Doing so, we hit the breakpoint, and from there we're able to step into functions. We get a stack trace and some visualization of data (though we don't get all of the &str visualized):
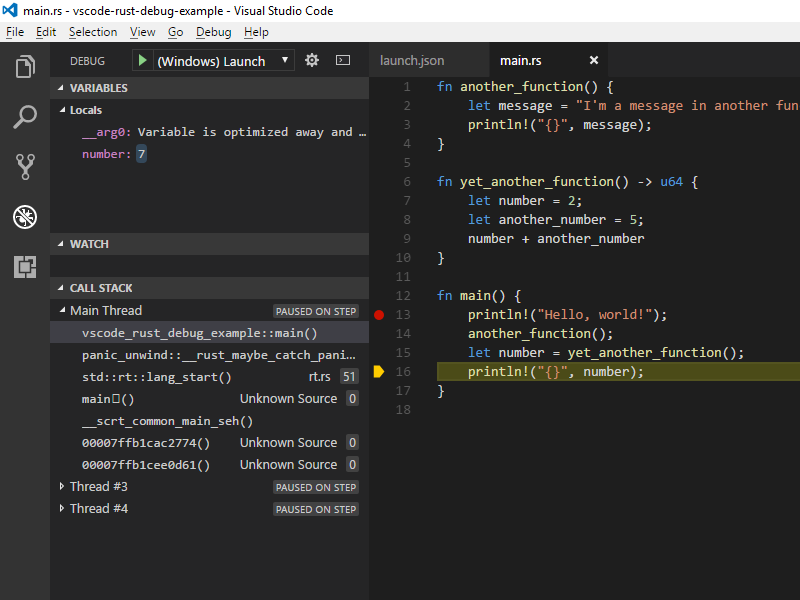
We're also able to step out, and can keep stepping through the program happily:
Wrap up
And that's Rust debugging is VSCode! If you have any questions or comments (especially if you know how to improve more on the debugging experience) let me know!