Poor Alder Lake performance when building Firefox due to bad scheduling
I recently assembled a machine that has an Alder Lake CPU (Intel's 12th generation Intel Core). Specifically, a 12700F and running Windows 10. The machine had been performing well until I attempted to build Firefox on it. Not only was the build incredibly slow, taking more than an hour when I'd expected about 20 minutes, it made the system unresponsive for long periods of time, with various other programs on the system becoming unresponsive for minutes on end.
After ensuring various drivers were up to date and flashing my BIOS to the most recent version, the issue remained. Some further tinkering revealed that during the build, most of my CPU cores were idle, but a subset were pegged at 100%. Digging further, it seemed that the issue was that processes involved in the build were being bottle necked by only being scheduled against a subset of my cores. This led to a very slow build, and also led to very poor performance of other tasks that got scheduled against those cores.
Alder Lake architecture
Alder Lake CPUs have two different kinds of cores:
- Performance cores (P-cores, also known as Golden Cove) - these run at a higher clock rate than E-cores, and are supposed to be preferable for single threaded, low latency tasks.
- Efficient cores (E-cores, also know as Gracemont) - these run at a lower clock rate than P-cores, but are supposed to be preferable for power constrained tasks, and may be better in multi-threaded scenarios.
Not all Alder Lake CPUs have both kinds of cores. All CPUs have some number of P-cores, but at time of writing, only high end i5 and above CPUs have E-cores. My i7 12700F has 8 P-cores and 4 E-cores, and each P-core has 2 threads. I.e. my machine has 20 total threads, 16 from the P-cores and 4 from the E-cores.
The idea is that by having both kinds of cores, the operating system can schedule tasks to cores whose type is appropriate to that task. This should ideally lead to things like power savings (and thus lower operating temperatures) and performance improvements. Intel have a technology called the 'Intel Thread Director' which is exposed to the operating system to provide information to help the OS make scheduling decisions.
Intel's game dev guide on the architecture is an interesting read if you want more information than the quick summary above.
Scheduling gone wrong
For whatever reason, Windows 10 seems to make some questionable decisions when scheduling the build tasks involved in a Firefox build. That is, it seems to only schedule tasks to E-cores. I found this surprising, as even if the E-cores are best suited, I would have expected it to overflow tasks to P-cores once the E-cores are fully in use. However, this does not appear to be the case. Worse yet, Windows seems committed to scheduling other tasks to the E-cores. So things like internet browsing, or even using the File Explorer, have large periods of unresponsiveness (10s or seconds, or even minutes).
Windows' Resource Monitor doesn't show which CPUs are P-cores or E-cores, but gave me the following information during compile
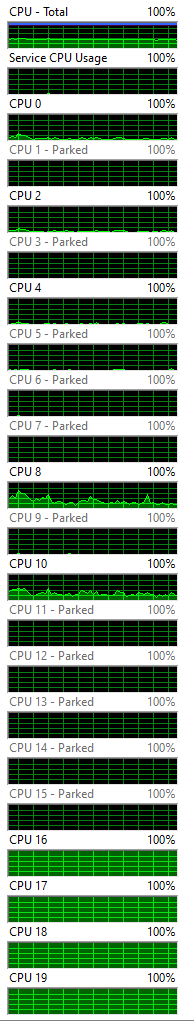
Note, the 100% labels on the graphs are supposed to show the top of the graphs as 100%, but are confusing when the graphs are in the small display mode (they're not saying all cores are at 100%). So only the last 4 cores are really doing anything, and most of the other cores are parked or doing very little.
The story becomes a little clearer when looking at this using CPUID HWMonitor
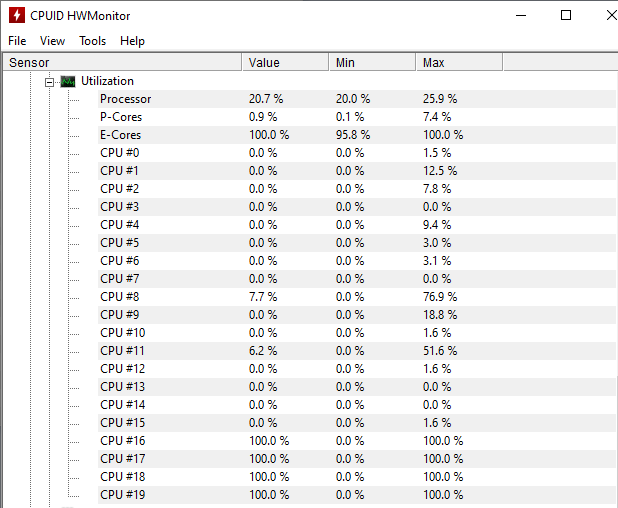
While it doesn't say which cores are specifically P-cores or E-cores, it does show that the P-cores are doing very little, while the E-cores are maxed out. From this I figured cores 16 through 19 are my E-cores, because they're the ones maxed out.
Disabling the E-cores
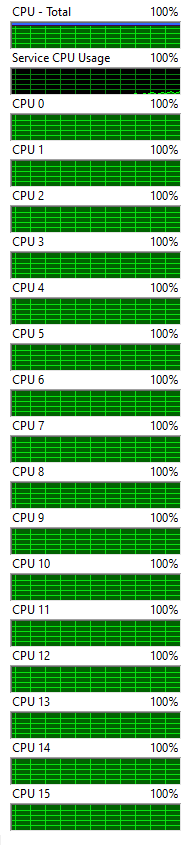
To test my theory, I went into my BIOS and disabled all my E-cores. After returning to Windows and starting a clean build, I got the following from Resource Monitor
and similarly from HWMonitor
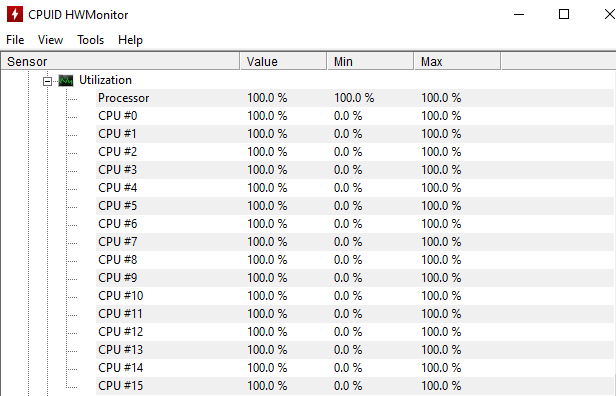
showing the system now fully using all the P-cores.
This resulted in a much faster over all build. With E-cores enabled, the build took 73 minutes and 7 seconds, compared to 17 minutes and 30 seconds without the E-cores. The machine was much more responsive during the compile with E-cores disabled, while it was unusable for certain tasks with the E-cores enabled.
What to do?
Obviously it would be nice not to have some of my cores disabled. It would be cool if there was a way to indicate that I'd like to use P-cores, and only if those are fully in use, to then start distributing work to the E-cores, but I'm not aware of a way to do that.
Discussions on the internet suggest that Windows 11 may do a better job at scheduling than Windows 10, but I'm not yet ready to upgrade.
For now I'm leaving my E-cores disabled, as I'm not sure of another way to dodge the issue.